12 Line Graphs That Sum Up Our Lives at Work
In January 2014, I wrote a post called “These Line Graphs Perfectly Sum Up Our Lives from Start to Finish.” It was a big hit and fetched 140,00 views on Business Insider.
Line graphs like this one:
I decided to create 12 more line graphs and this time focus on our lives at work.
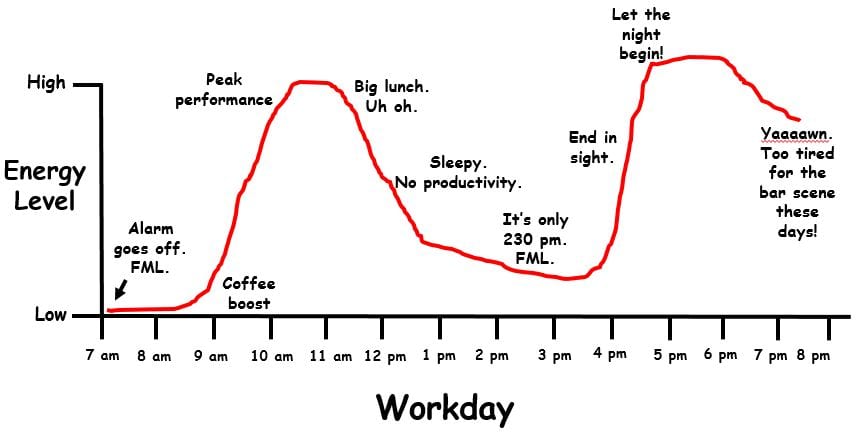
Let’s start with how we feel throughout the day.
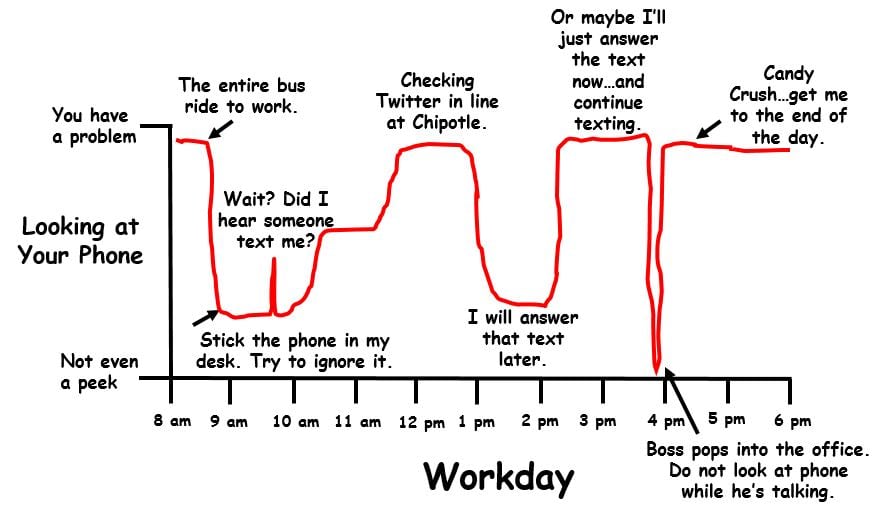
High energy. Low energy. Doesn’t matter — we can’t stop looking at our phones.
Bored at work? Remember YOU control your destiny.
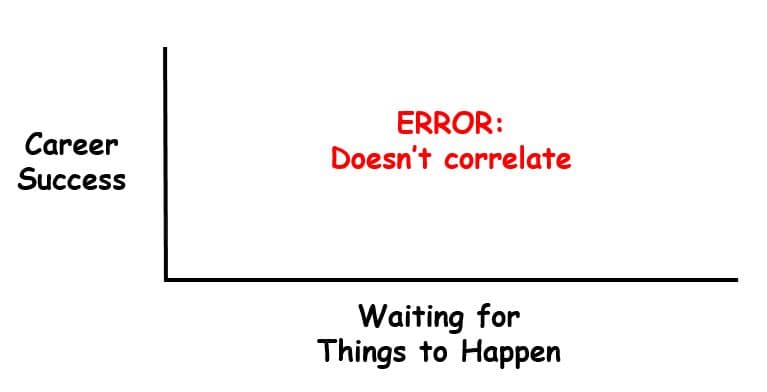
There’s a better way.
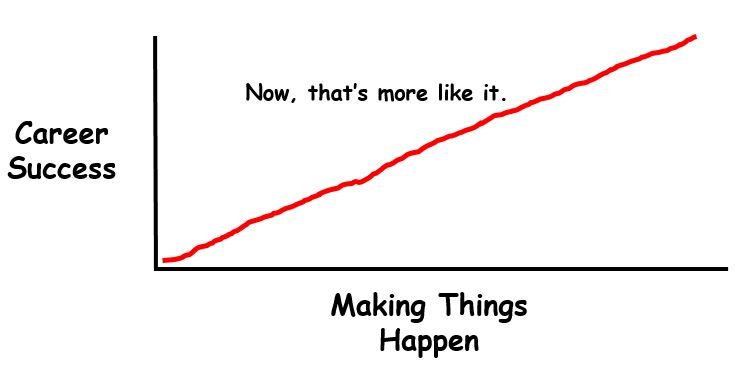
If you’d like help as you “make things happen,” check out my career coaching and read the testimonials.
Because aren’t you sick of this graph?
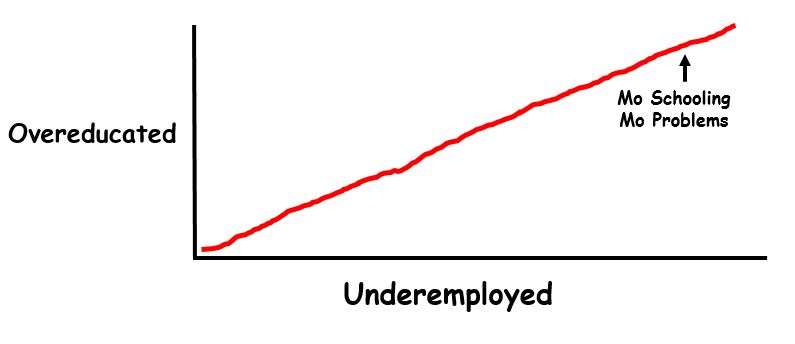
Oh, this graph too. The WORST.

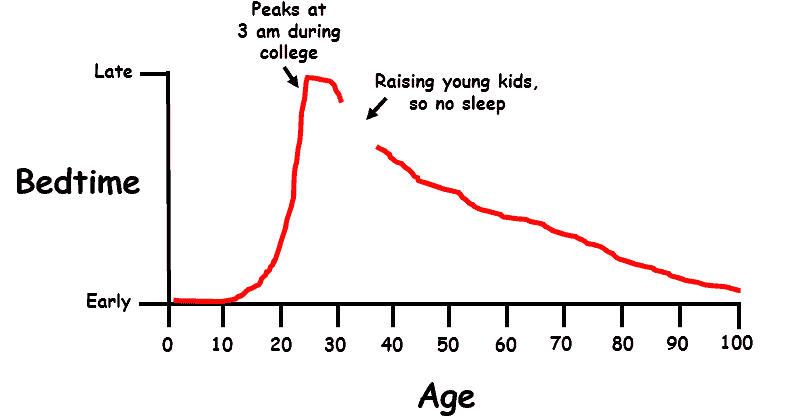
We can all relate to the generational divide in the office.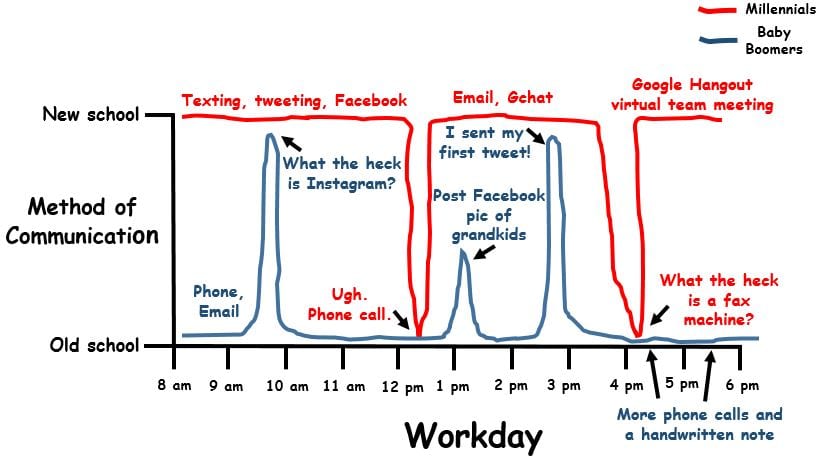
And the generational breakdown in our own families.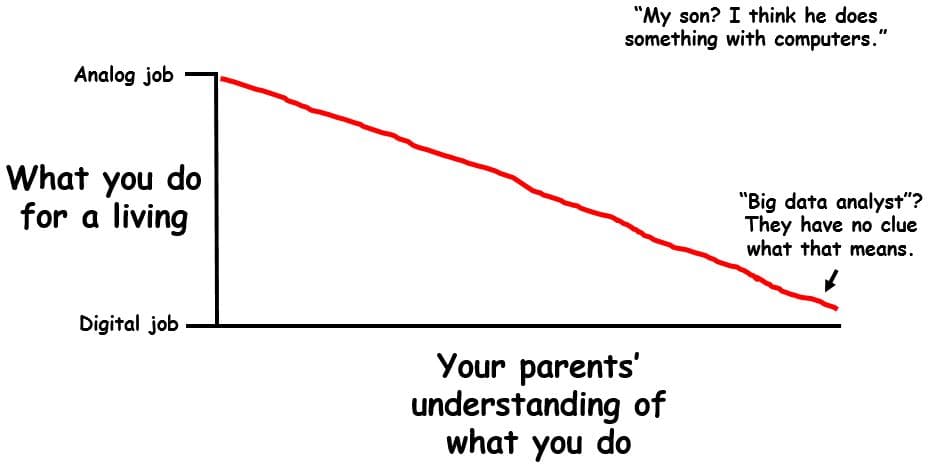
Of course, networking matters at any age.

Gen Y needs networking skills — we bounce around all the time!
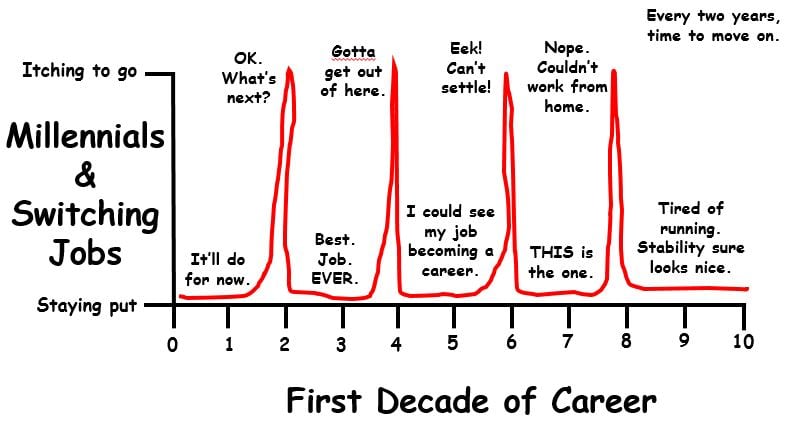
If we’re not switching jobs, we’re stuck in a chair somewhere.

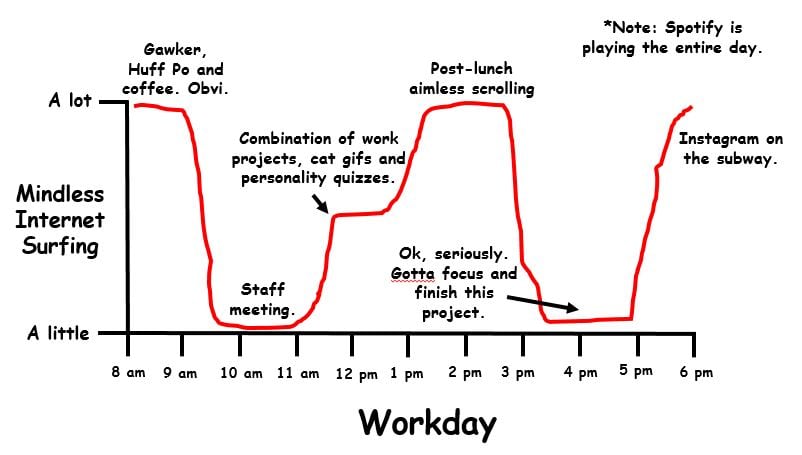
And finding ways to pass the time.
Put your idle moments to good use. Start a blog and transform your career!
—
Which line graph hit home the most for you?
Share below!
Related Articles
September 25, 2012
Why You Should Never Delete Your Facebook Friends
Don’t even think about cutting people loose. Your career may depend on it.
Read More
October 17, 2016
Virginia Beach City Public Schools Pilots Danny Rubin’s “Wait, How Do I Write This Email?”
Early advocate at the high school level.
Read More
May 26, 2014
6 Most Powerful Words in Networking
Want to speak volumes about your character? Don’t talk.
Read More